Information Retrieval Lecture 4: Evaluation and Cranfield Paradigm
Background reading: Zhai, Ch.9. With the previous lectures we should be able to implement a simple search engine. Now we ask how to evaluate whatever we could have built.
In class exercise
Suppose you are the VP of Search at a giant internet retail company. Your boss brings in her nephew, who claims to have built a better search engine for the company.
- How would you react to this statement?
Well, smells like nepotism. So I would be very sceptical about this statement. I guess it could be possible if the search engine is specialized for this particular site. Site search?
- How do you assess the quality of the new system?
Set up a series of example queries with best-selected matches. Key metric for effectiveness, precision, recall etc. Evaluate top-10 results. Measure speed and relevance (how would we measure relevance?).
Perhaps speed in terms of user clicks and time.
Other ideas, online ranking: user study with two test groups, A/B testing.
The amount of sales itself could also be an indication of the search quality because we're dealing with an online retail company.
What to measure?
- Effectiveness
- How accurate are the search results
- Efficiency
- How fast do users get results? / throughput
- Usability
20 min in, Faegheh discusses a bias effect of personalized systems; I didn't pay attention here but may be interested to review. Example: Microsoft chat bot because it starting making extreme and racist claims.
Cranfield Paradigm
Central idea:
- Build a re-usable test collection
- Define measures
For the test collection, we have a relevance judgment for each document given a particular query.
Building test collections:
- Test documents
- Each document has a type of retrieval unit. For Twitter, it's a tweet. For a web forum it is a thread.
- Set of search queries or 'topics'
- Relevance assessments for each search request.
Ground truth labels for query-item pairs may be
- Binary
- Relevant or not?
- Graded
- 0-3; from non-relevant, somewhat relevant, relevant, highly relevant.
- Faegheh seemed to suggests you do not have to measure these linearly; e.g. you may punish non-relevance more heavily.
- E.g. in NDCG you can change the discounting function
This is obviously very time consuming and expensive. There are two common approaches:
- Crowdsourcing
- "Microtasks" by a large crowd
- Amazon Mechanical Turk
- Figure Eight (Crowdflower)
- Expert judgement
For crowdsourcing you should implement some control mechanisms to ensure quality of the work:
- Have an intake quiz to make sure the worker understands the task
- Hidden tests to avoid people knowingly doing a quick shitty job to get their money
- Ensure the payment is fair; then you can also expect fair work.
Expert judgment uses experts that are trained for the task. As a result, each query-item pair requires fewer assessments than with crowdsourcing. This is also because agreements between expert annotators is generally high.
Example: TREC
- Yearly benchmarking cycle.
- Multiple tracks
- E.g. this year was about COVID search.
- Organized by US National Institute of Standards and Technology (NIST)
However, when we have real collections with millions of documents, this approach with one judgment for each document is completely infeasible!
Pooling approach
Instead, let multiple baseline systems retrieve documents based on a query, combine these together in a pool, and then create relevance judgements for those. So not all query-document pairs get relevance judgements. As as consequence, if some future system will retrieve that document, it is consider irrelevant by default. This is a small downside, but if you have a broad set of baseline methods, it is quite unlikely that this will be happen.
Q: Explain the two key points of the Cranfield paradigm and why they are useful for evaluation.
Q: What is "pooling" during the creation of test datasets (e.g. by TREC) and what problem does it solve?
Set-based Retrieval Evaluation
These are set-based because they do not further take the exact ranking of the retrieved results into account.
We need to consider precision and recall together, because there is a precision-recall trade-off.
Return all documents will give a recall of 1, but then precision is terrible. If you return very little documents, you may have a precision of 1 but a terrible recall.
Which measure if more important may depend on the application. Generally, we take a harmonic mean between recall and precision, which is the F-score. The harmonic mean penalizes cases with high value only for either precision or recall. When both are roughly similar, we'll have a higher F-score.
F1 = 2PR / (P + R)
We may have additional beta terms
$F_{\beta} = \frac{ (\beta^2 + 1) P * R }{ \beta^2*P + R}$
For beta is 1, we weight precision and recall equally. For higher beta, we weigh precision more.
Why do we not use the arithmetic mean?
The arithmetic mean is affected more by large values.
E.g. P=0.1 and R=0.9 (example of terrible system), mean = (0.1+0.9)/2 = 0.5. That's still a pretty high mean!
F1 measure = (20.10.9)/1 = 0.18
When computing recall, take into account that it is defined against the total amount of relevant documents, which may or may not correspond to the amount of relevant documents in the ranking (the false negatives are by definition not in the ranking so only with FN=0 are all relevant docs in the ranking). If you rank@10 and there are 16 relevant documents, you'll never have all relevant documents in your ranking independent of how good your ranking function is.
Also note that everything returned in the ranking is considered as a "positive".
Rank-based Retrieval Evaluation (Binary relevance judgments)
- Binary relevance
- Precision@K (P@K)
- Recall@K (R@K)
- Mean Average Precision (MAP)
- Mean Reciprocal Rank (MRR)
Precision@K
Set threshold K, where we assume the user will stop looking. Compute precision for top-K retrieved results and ignore lower ranked documents.
Precision-Recall Graph for different K cut-offs
 from Zhai p.176.
We know there is a trade-off between precision and recall, which we can visualize with a precision-recall graph. We can use interpolated precision for this. This is a common way to compare search engines. We know already that when we increase K, the precision is going to drop.
- Make one curve per query
- For each query, compute precision and recall for the first ranked result, then the second and so on.
- We expect that generally precision drops and recall increases during this process
- Notice that this produces erratic behavior: when you encounter a non-relevant document the recall stays the same but the precision drops, thereby producing a vertical line; we thus do not plot a "function" as of now.
- We want to average over queries at fixed recall levels (x-axis)
- We need to interpolate precision because we do not have a precision measurement for each recall level
- We want the interpolation to preserve the fact that precision is overall monotonically decreasing as recall increases
- One way to achieve this is for recall R to pick the max precision observed for R' >= R.
- This produces a step function for each query
- Now you can average over queries to produce precision-recall curves
Q: Explain the idea behind interpolated precision as used in precision-recall plots.
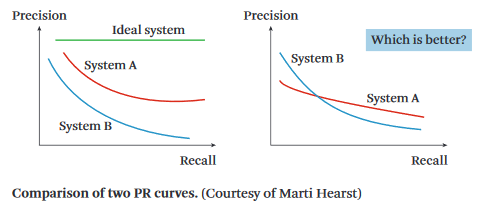
Q: Why are precision-recall plots so handy for comparing search engines? (Hint: a search engine A may be better than B in some settings but not in others)
MAP: Mean Average Precision
Assume we have different users that stop users are different thresholds, so we have various K's. If we vary on these thresholds, how will the system perform on average?
For a single query:
- We compute precision only at each point in the ranked list where the recall increases.
- Sum over these precision scores
- Divide by total number of relevant documents in the collection (not only the ones we retrieved!)
- Now we have the average precision
- Now take the mean of the average precision over all queries/rankings: then we have MAP
MRR: Mean Reciprocal Rank
Assumption: There is only one known relevant document.
This metric is useful for question answering, where we may expect there is a single best answer.
- Take reciprocal rank 1/r, where r is the position of the relevant document in the retrieved ranking.
- Take the average of all reciprocal ranks over all queries.
Plenty of theoretical problems: for example that it uses a ratio scale, which makes averaging strictly speaking senseless. But it's used nevertheless in practice.
What is the justification behind taking 1/r?
Imagine we have system A and system B, with queries Q1 and Q2. See case in slide 32. Dotted vertical line is average. Intuitively, system A is better than system B. But when we use reciprocal rank, system B is suddenly ahead. This is an example where MRR reverses the ranking and provides unintuitive results.
In practice, there's not really other metrics for the assumption we only retrieve one document. Perhaps that's also why it's still used in practice.
We discussed rank-based retrieval evaluation functions. We started with binary methods.
We now discuss relevance measures on a graded scale; degrees of relevance.
Q: What is the main use case for Mean Reciprocal Rank (MMR)?
Q What is a main theoretical issue with MMR?
Normalized Discounted Cumulative Gain ( NDCG )
Normalized Discounted Cumulative Gain uses graded relevance as a measure of usefulness: what does the user gain from reading that document?
Gain is accumulated starting from the top of the ranking. We cumulatively sum the gains from traversing the ranked list from top to bottom:
$$CG(L)=\sum_{i=1}{n}r_i$$
Where $r_i$ are graded relevance judgments/gain.
Two main assumptions:
- Users care most about the top ranked results
- Highly relevant documents are more useful than marginally relevant documents (graded relevance assumption)
But cumulative gain does not yet penalize low ranking documents; since we just stated that lower ranking documents are less useful to the reader.
So we discount the gain of lower ranking documents by dividing the gains by the logarithm of the rank. We do not discount the top ranked result.
$$DCG(L) = r_1 + \sum_{i=2}^n \punishingfrac{ r }{ log_2 i}$$
Note that i is the rank here; $r_1$ is the gain at rank 1.
Q: Why is a logarithm used in the denominator of the cumulative gain?
A: We care mostly about getting the top ranks right and the logarithm is most sensitive here. We don't really care about discounting the 1001th rank way more than the 1000th rank.
There is only one issue left. The DCG willl have different scales for different queries/topics. For example, for one query we may have 6 highly relevant documents, whereas for another query we may have only 2. This will obviously influence the scale of the DCG.
So if we want to meaningfully compare the DCG of two queries, we need to both normalize them (in the range [0,1]) relative to their ideal ranking.
The ideal ranking is just the ranking sorted on the known relevance judgements. I was wondering whether we need tie-breaking, but we don't as only the gain counts in this case.
It makes sense that the result will be in [0,1] because the DCG is discounted and thus will never be larger than the ideal ranking.
$$N DCG(L) = \frac{DCG(L)}{Ideal DCG}$$
Now the query difficulty etc. is taken into account, because performance is measured relative to how good we could have done for the current query.
Normalization does not affect the performance comparison because the ideal DCG is the same for each system. It's the same for a given query, independent of the retrieval system.
Q: Why do we need to normalize the cumulative gain of a ranking for meaningful evaluation?
Q: How does NDCG factor in query difficulty?
Now, we want to normalize the ranking compared to the idealized ranking. Normalize the observed discounted cumulative gain by that of the ideal ranking. This is the most common evaluation setting in the Web Search literature (see p.182, Ch.9 of book).
If you are implementing any evaluation measures, check trec_eval first. This is a great reference tool to check correctness of your results.
Slide 8:
- In Experiment I, System B is better based on the MAP mean average precision.
- However, in Experiment II System B still has the better MAP, but also clearly has a high variance.
- So this reduces the certainty with which we can say that condition 2 is better than condition 1.
Significance testing takes this into account.
Q: What are the two main assumptions employed in NDCG?
Significance Testing
- How likely is the observed difference due to randomness?
- Wilcoxon signed-ranked test and t-test are relevant here